WordPress Performance 2026
Improve the loading time of your own website
Google has made loading speed (website speed or PageSpeed) a decisive ranking factor. Since then, it has been essential to check and, if necessary, optimize the loading time of your own website to ensure that it can be found. Mobile users with smartphones or tablets don’t like slow websites on the go. Although high-speed Internet access for mobile devices is already available in conurbations, the Internet connection via smartphone is usually considerably slower than in stationary WLAN. Optimization for fast loading times is therefore particularly important. In any case, the loading time of the web page should be less than 3 seconds, ideally 1.5 seconds.
Google likes fast loading websites
Google Ranking
The loading time in which a website is built is a ranking factor and an important quality feature for Google. Fast loading times improve the positioning in the search engines.
Who wants to wait?
User-friendly
What’s important to Google is just as important to website users. If you want your website to be professionally set up, a good look is no longer enough. Loading times in particular are a criterion for whether the website is popular with potential customers. Otherwise, services and product presentations become a nerve-wracking thing and customers jump out prematurely.
Faster = Better
bounce rate
Visitors to a website do not wait for long loading times. You leave the website before it is fully loaded. High bounce rates are the result, which also has a very negative effect on Google’s ranking.
Every second more sales
increase in sales
Loading times are not only a decisive factor for your turnover in e-commerce. However, optimizing the page speed is particularly important in this area. Surveys at online retailer Amazon have shown that 100 milliseconds of additional loading time result in a drop in sales of around 1 percent.
Smartphone users love speed
Mobile Devices
The technologies for mobile connections are still relatively slow and not comparable with a high-speed connection at home or at work. However, mobile website users are a considerable customer potential that should not be forgotten. PageSpeed optimization is especially important for the use of mobile devices.
PageSpeed Optimization for WordPress Websites
We specialize in optimizing your WordPress website for fast loading times.
Measuring charging times
We determine the loading times of your website in a comprehensive analysis. We use various tools and analysis programs, various Internet connections and various terminal devices.
optimization
Through suitable measures such as source code compression, caching, image optimization and many other optimizations, which we have described below, we ensure optimal loading times for your website.
Benefits
Once all optimizations have been carried out, you will receive detailed statistics and results analyses from us. This allows you to check for yourself how the loading speed of your website has improved.
Measures to optimize loading time
WordPress Performance 2026
Optimize all images
Merge style sheets
Reduce HTTP requests
Minify/Summarize HTML
Minify / summarize CSS
JS minify/combine
Activate delayed JS (defer)
Enable LazyLoad for images
Using CSS sprites
Using server-side caching
Set up browser caching
Setting up Gzip compression
Set up CDN
301-reduce redirects
Using a dedicated server
Improve server response time
Use current PHP version
Set up SSL certificate
Reduce plugins on the website
Enable HTTP / 2
Agency prices performance optimization
Website performance and page speed optimization
Analyzes
The first step in our optimizations is to figure out what is slowing down your website and decide what is worth investigating. There are two tools that help us with this.
Lighthouse
Google Lighthouse focuses on metrics tied to Google’s understanding of user experience and SEO, such as Largest Contentful Paint (LCP) or Cumulative Layout Shift (CLS).
GTmetrix
GTmetrix provides a more comprehensive technical performance assessment. This gives us insights into the page size, the number of requests and many other evaluations.
Performance Optimization
1990€
(plus VAT)
Website Analysis
Lighthouse analysis
GTmetrix analysis
Server optimization
Improve server response time
PHP Version Update
Aktiviation HTTP/2
Secure Frame Headers setup
Use SSL
WordPress system optimization
Check the number of plugins and reduce them if necessary
Minimize number of fonts
Switch fonts to system fonts (if necessary)
Preload fonts with code
Caching optimization
Activation and configuration caching
Minification HTML/CSS/JS
Defer HTML/CSS/JS
CORE WEB VITALS Optimization
First Contentful Paint
Largest Contentful Paint (LCP)
Total Blocking Time
Cumulative Layout Shift
Accessibility optimizations and best practices are not included in the services, but can be ordered separately if these measures are necessary.
With these optimizations, we achieve a significant improvement in performance, e.g. from the red area below 50/100 points to the orange/green area of the lighthouse analysis (89-93/100).
Image optimization
700€
(plus VAT)
Images analysis
Analysis of the images on the website
Analysis of the images in the media library
Images compression
Sizing images to the correct sizes
Setting up a plugin for image optimization
Set lazy load
Image format optimization
Convert jpg, png formats into next generation images
Converting images to .webP formats
Providing .svg format
Providing .avif format
Do not use images as “background”.
The price for image optimization is calculated for a single web page.
By converting the images in the media library into the .webP format and using a corresponding plugin (plugin licenses and costs are not included), sufficient optimization of image performance is usually achieved.
Test website performance yourself
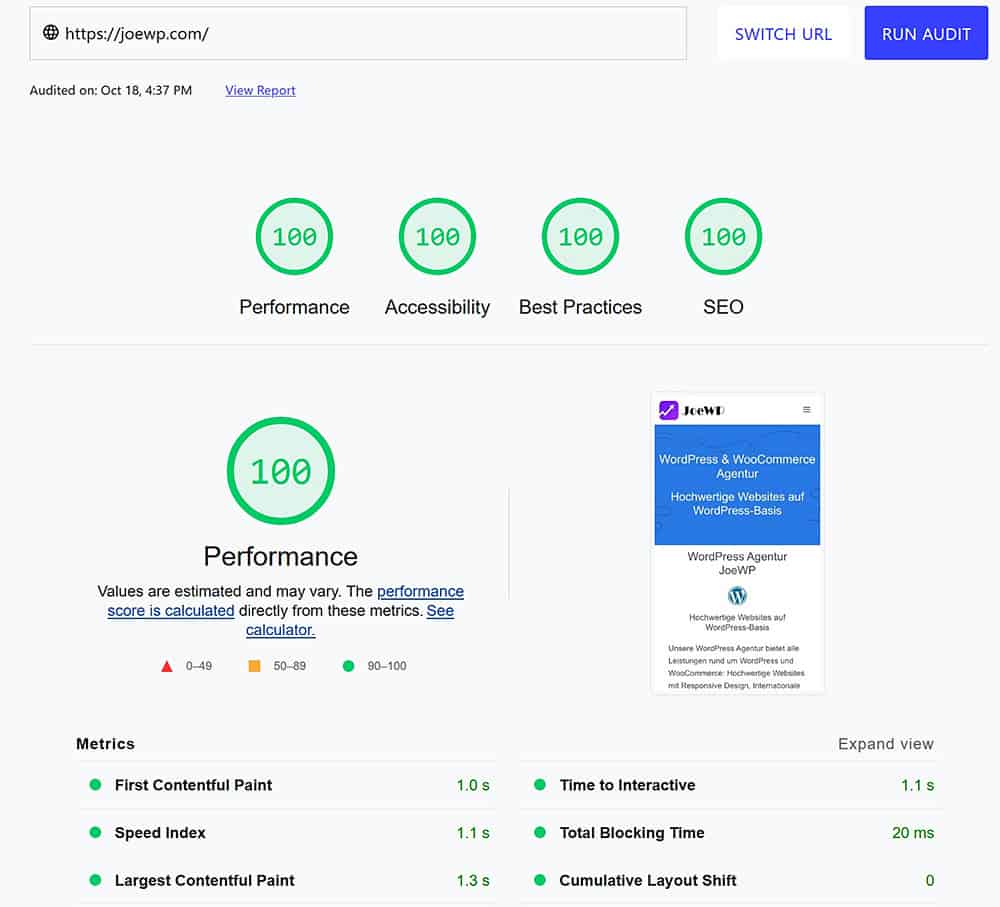
The following tests show the performance of the JoeWP website
The loading speed of a website is extremely important. The full display of the website should be under 2 seconds. With loading times of more than 3 seconds you lose customers who usually don’t come back. Especially for websites of companies and companies as well as shops the loading time of the website is crucial for the business success. With the right technology and programming as well as especially the optimization on speed (PageSpeed optimization) the website will have the desired success.
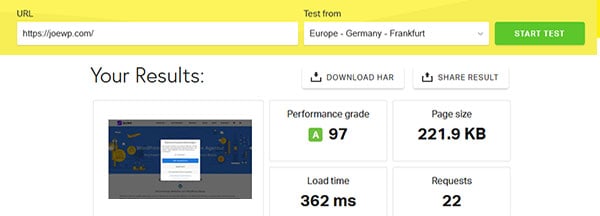
Pingdom Website Speed Test
The Pingdom test provides an effective overview of the performance of your own website with results on the degree of optimization and the loading speed. Tip: perform the test 2 to 3 times in quick succession, as the first result is output without caching. The further results then show the real cached value. Users from Europe should test via “London / Frankfurt”.
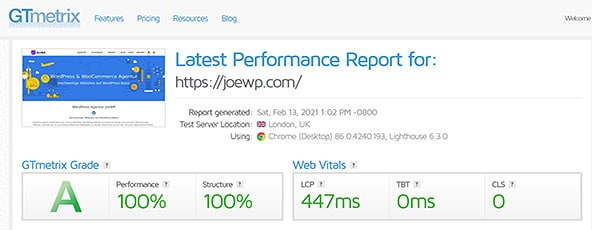
GTmetrix
GTmetrix uses various test methods and displays them in a collected form. So z. For example, YSlow and Waterfall results are displayed on different tabs. After the test result has been output, suggestions for optimization are given. The only disadvantage is that the test is carried out in Vancouver – Canada and the values for Germany are therefore not displayed optimally. With a free GTmetrix account can also be tested from London.
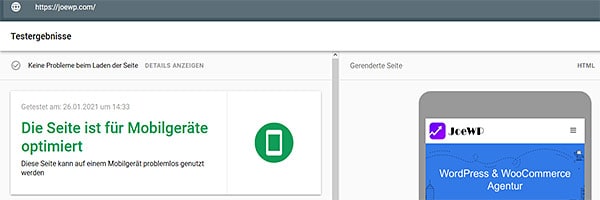
Test Optimization Mobile Devices
The Google mobile optimization test makes it easy to easily and easily determine if your website is suitable and optimized for mobile devices such as mobile phones, smartphones and tablets. Normally, this should be standard on modern websites (Responsive Website).
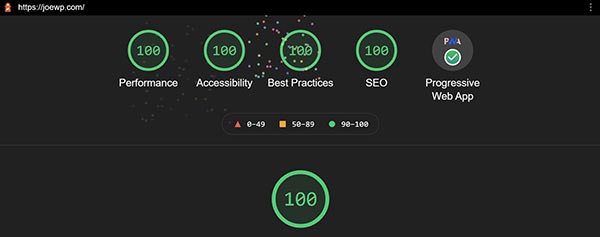
Lighthouse
There is another option for developers to extensively examine the performance of the website. Lighthouse is an automated open source tool for improving the quality of websites. It has audits for performance, accessibility, progressive web apps, SEO, and more. The tool performs a series of checks and then generates a report on the health of the page. You can run Lighthouse in Chrome DevTools or from the command line.
Google PageSpeed Insights
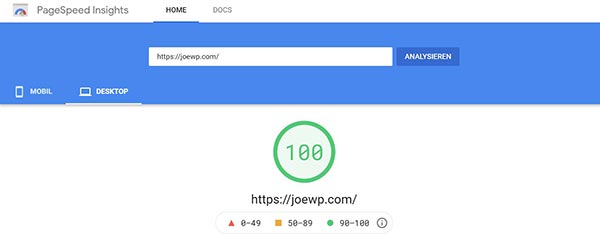
Result for desktop
With the PageSpeed Insights Tool (PSI) from Google you can examine a website for speed and optimization possibilities.
The tool tests the performance for both desktop and smartphones. There are also recommendations for improving the user experience. PSI’s report provides a rating that summarizes the site’s performance. The given score is obtained by running Lighthouse to collect and analyze laboratory data through the site. A (green) score of over 90 is very good. A score from 50 to 90 (orange) indicates that the website should be improved. A result below 50 (red) is considered bad.
Speeding up a website is usually not an easy task. It is often difficult to diagnose why a website is running slower than it should. The problems start with poorly written code up to not optimized and too large images and page elements, too many plugins etc.
It is important to diagnose and fix these issues, otherwise Google will rate the site in question poorly. Google prefers websites that load quickly. If the website is fast, it will rank better on Google than slow websites.
Google PageSpeed Insights
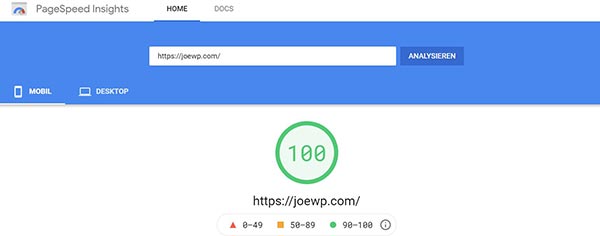
Result for mobile
Lighthouse is currently simulating the loading of pages on a mid-tier device (Moto G4) on a cellular network.
PSI offers laboratory data and field data on one page. Laboratory data is useful for debugging performance problems because it is collected in a controlled environment. Field data is useful for capturing a real user experience. PSI shows the metric data First Contentful Paint (FCP), First Input Delay (FID), Largest Contentful Paint (LCP) and Cumulative Layout Shift (CLS) for the specific page URL.
Web Vitals is a Google initiative to provide consistent quality signals. Core Web Vitals defines the user experience on the web. Optimizing the user experience is key to any website’s long-term success. Web Vitals can quantify the user experience of your website and identify opportunities for improvement.
Core Web Vitals contain a number of signals that are of primary importance to any web experience. The Core Web Vitals metrics are FID, LCP, and CLS with their respective thresholds. A website passes the Core Web Vitals rating if the 75th percentiles of all three metrics are good. Otherwise, the page fails the rating.
Core Web Vitals
The PageSpeed is evaluated by Google both through a live test and through stored test results, the “Lighthouse Audits”. In the Google test results, the “Web Vitals” show all the indicators that make a website user-friendly. Website owners shouldn’t be performance gurus to understand the quality of user experience they are providing to their website visitors.
Web Vitals is a Google initiative to provide consistent guidelines for quality signals that are essential for the best user experience on the web. The Web Vitals initiative aims to simplify the user experience and help websites focus on the most important metrics, the Core Web Vitals. The Web Vitals became the official ranking factor on Google in April 2021.
The metrics that make up Core Web Vitals will evolve over time. The current set for 2020 focuses on three aspects of the user experience – loading, interactivity, and visual stability – and includes the following metrics (and their respective thresholds):
Largest Contentful Paint (LCP):
LCP evaluates the loading speed of your website. For an optimal user experience, the LCP value should be within 2.5 seconds of the first page view.
Typically, images or videos are used as elements for the Largest Contentful Paint. An element is not considered an LCP until it is fully rendered and visible to the user.
This metric is also related to the First Contentful Paint (FCP), which measures the time it takes to render the initial DOM content. However, unlike FCP, LCP takes into account the time needed to render the largest and most important content on the page.
- What LCP stands for: The perceived loading time from the user’s perspective.
- What is measured: The point in the page load timeline at which the largest image or block of text appears in the visible area.
- How it’s measured: Lighthouse collects LCP data using the Chrome Tracing tool.
First Input Delay (FID)
First Input Delay (FID) measures the interactivity of a website and focuses on input events such as clicking, tapping and key presses. When a website does not respond quickly after a user interaction, users perceive this as a lag or slowdown. For a good user experience, the FID of your web pages should be 100 milliseconds or less.
- What FID stands for: Your user’s first impression of your website’s interactivity and responsiveness.
- What is measured: The time from when a user first interacts with your website (e.g. clicking a link, tapping a button, or using a custom JavaScript control) to when the browser can actually respond to that interaction.
- How it is measured: FID requires real user interactions and therefore cannot be measured in the laboratory. However, the Total Blocking Time (TBT) metric is measurable in the laboratory and correlates well with FID in the field. Optimizations that improve TBT should also improve FID in the field.
Cumulative Layout Shift (CLS)
CLS measures the visual stability of a website. A good CLS value is 0.1 or less to ensure that users do not experience unexpected layout changes. This is less a measure of page speed and more an indicator that your site is following best practices, which is important for a high performance score.
These best practices include following common UX patterns that are optimized for CLS. When loading the page, size attributes should always be set or placeholders reserved to prevent the page from jerking and shifting during interaction.
Your website should not insert new content over existing content unless the user expects it through their interaction. When making layout changes during interaction, use transformation animations to ensure stability.
- What CLS stands for: The visual stability of a page. Instability means unexpected movements of page content during user interaction.
- What it measures: CLS measures the largest increase in layout shift scores for any unexpected layout change over the lifetime of a page. A layout shift occurs when a visible element changes its position between two rendered frames.
- How it’s measured: To calculate the layout shift score, the browser looks at the size of the viewport and the movement of unstable elements in the viewport between two rendered frames. The layout shift score is the product of two measures of this movement: the impact component and the distance component.
First Contentful Paint (FCP)
Measures the time to render the first DOM content
- What it stands for: The time it takes for the browser to render the first DOM content after a user visits your page. DOM content includes images, non-white
<canvas>elements, and SVGs on your page. - What it measures: FCP is a user-centric metric that measures perceived loading speed. It marks the first point in the page load timeline at which the user can see something on the screen.
- How it’s measured: The FCP score compares your page’s FCP time to the FCP times of real websites, based on data from the HTTP archive.
Speed Index (SI)
- What it stands for: The average time that visible parts of the page are displayed.
- What it measures: The Speed Index measures how quickly content appears visually when a page loads. Lighthouse creates a video of the page loading process and calculates the visual progress between frames.
- How it’s measured: The Speed Index score compares your page’s speed index with the indexes of real websites, based on data from the HTTP archive.
Total blocking time (TBT)
- What it stands for: The total amount of time a page is prevented from responding to user input, such as mouse clicks, screen taps, or keyboard input.
- What it measures: TBT measures the time between First Contentful Paint (FCP) and Time to Interactive (TTI). It is the laboratory equivalent of the First Input Delay (FID) used in the Chrome User Experience Report field data and in Google’s Page Experience ranking signal.
- How it is measured: TBT calculates the total time the main thread is blocked by tasks that take longer than 50 ms. If a task takes 80 ms, 30 ms of this time counts towards the TBT. If a task takes 45 ms, 0 ms are added to the TBT.
Time to first byte (TTFB)
Time to First Byte (TTFB) is a basic metric that measures the time between requesting a resource and receiving the first byte of the response. It helps determine whether a web server is responding too slowly to requests.
TTFB consists of the following phases of the requirement:
- Redirection time
- Service worker start time (if applicable)
- DNS lookup
- Connection and TLS negotiation
- Time from request to arrival of first byte of response
Tools to measure and report Core Web Vitals
Google believes that the Core Web Vitals are critical to any web experience. Because of this, it has made it a goal to publish these metrics in all of its tools. Tools that support Core Web Vitals are PageSpeed Insights and the Core Web Vitals report of the Search Console. There are a number of other tools for developers, but they are not suitable for normal website users.
Note (Update February 2026): We update this page again and again and adapt it to the current developments in Internet technology. Performance optimization is a constantly changing process. New techniques require a rethink in terms of performance. Our suggestions and tips are kept up to date here. So it pays to visit this site every now and then.
